The GMA Is Back. Some Grades Surprise. Most Don't.
The Signal
GEOINT 2026 wrapped in Aurora. The gap it couldn't close followed everyone home.
Four days, ~4,000 attendees, NGA leadership on the main stage, three tracks: GeoAI, GEOINT Data at Speed, and Scaling AI. The organizing question wasn't a theme — it was a genuine problem the community is still working on: how do you move a GeoAI system from benchmark to operation?
That question doesn't stay at GEOINT. It's the same one sitting under every promising geospatial AI demo that hasn't made contact with a production dataset yet. The community has closed this gap before — GEOINT pipelines run under real constraints against real data, and the sessions worth tracking when recordings surface are the ones in the Responsible AI and PEO Advanced Analytics tracks, not the keynotes.
→ nga.mil
NASA's viz team has been solving the hardest part of geospatial AI for years. They just don't call it that.
Geo Week News ran a profile this week on NASA's Scientific Visualization Studio — the team that turns mission and satellite data into the renders, maps, and 3D scenes you've definitely seen even if you didn't know who made them. The Artemis II lunar terrain previews are the current headline work.
But the part worth reading is the pipeline story. Before any of those visuals exist, the SVS team is reconciling data from sources that arrive in different resolutions, time scales, and reference frames. They've spent years building the plumbing mature enough to work directly with native science formats — skipping the intermediate conversion steps that used to eat time and introduce drift.
Read that again and swap out "lunar terrain" for whatever your organization's hardest integration problem is. Same job. The visualization is what ships. The reconciliation is what enables it. The SVS team is heading toward real-time systems that fuse telemetry, environment, and terrain into a single view — and that trajectory will feel familiar to anyone trying to build operational situational awareness in GIS.
→ geoweeknews.com
The Main Event
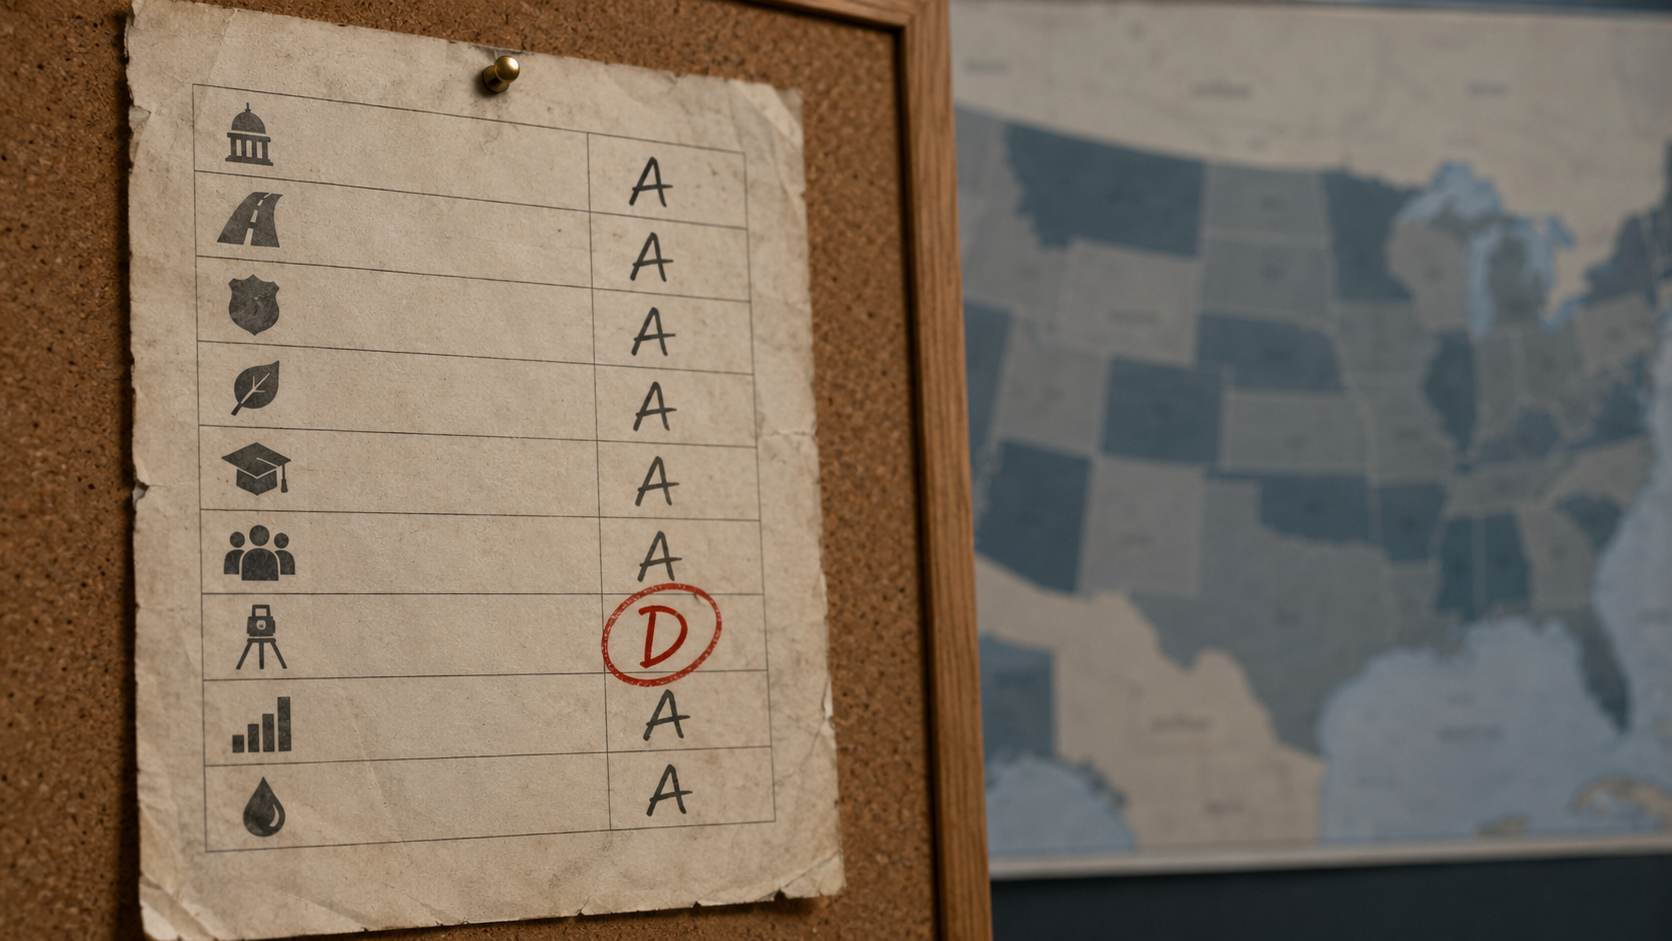
The 2025 GMA is out. What the grades say — and what they can't.
NSGIC dropped the 2025 Geospatial Maturity Assessment state report cards last week. Full report and dashboard are still pending, but the per-state cards are public now. If you work in state GIS and haven't pulled your card yet, it's worth the ten minutes.
Quick GMA primer for the uninitiated: NSGIC runs this every two years. States get graded across Coordination, Address, Cadastre, Elevation, Transportation, NG9-1-1, Geodetic Control, Government Units, and Orthoimagery (leaf-on and leaf-off separately). Most cards include a written response from the state GIO, and those responses are frequently more illuminating than the grades themselves.
The GMA is a blunt instrument. That's not a criticism — it's the point. Comparability across 50 programs requires asking everyone the same question the same way. You lose nuance. You gain signal. What it's good at is naming gaps that everyone in the room already knows exist but that rarely make it into a budget conversation. That's where it earns its keep.
A few things standing out across the 2025 cards:
Transportation is the most disputed grade in state responses, and the dispute is legitimate. The rubric leans on NG9-1-1-centered road centerline questions, but in many states the transportation agency and the 911 program are separate custodians with separate data lineages. You're not seeing a bad grade — you're seeing an institutional seam the rubric wasn't designed to navigate. Multiple state GIOs name this directly. NSGIC should look at how Transportation and NG9-1-1 scoring interact.
Orthoimagery leaf-off grades map almost exactly onto which states run dedicated acquisition programs. States relying exclusively on USDA's NAIP cycle don't have much to show here, and several say so plainly. The states with high leaf-off grades are the ones that made a sustained investment in their own programs. That relationship is direct and not accidental.
Coordination is structural, not operational. States with statutory GIS governance — a recognized GIO, a legislative mandate, an advisory council with actual teeth — score high here regardless of how the data themes are doing. That's the right read. Coordination infrastructure is what makes data programs possible to sustain over multiple administrations. When it's absent, even good technical work becomes fragile.
Cadastre is where the GMA is most honest and most uncomfortable. A D or F in Cadastre shows up in states with otherwise strong overall scores, and it's not a rubric artifact. It's a clean read on an old problem: parcel data access in the US is fragmented by county, inconsistently open, and stuck behind local decisions that state-level coordination hasn't been able to override. The states that score well here have either solved the political problem or built a workaround. Most haven't.
The 2023 GMA dashboard is still live at arcgis.com if you want cross-state comparison while the 2025 version loads. The full methodology report for 2025 is still pending — worth reading when it drops if you want to understand how grades are calculated.
→ nsgic.org/initiatives/geospatial-maturity-assessment
Hands On
Pull all 50 state GMA grades into a DataFrame with pdfplumber
The 2025 GMA cards are a single 200+ page PDF in alphabetical order. Great for reading. Painful for analysis. If you want to compare Cadastre grades across all 50 states, track movement since 2023, or just build a quick viz, you need the data out of the PDF and into something you can work with.
pdfplumber handles this reasonably well. The page structure is consistent enough that a regex-based approach gets you most of the way there without needing a layout model. The grade pattern is stable: theme name, whitespace, letter grade (A through F with +/- variants, and NA for not applicable).
pip install pdfplumber pandas requests
Start with pdfplumber.open(), iterate pages, regex-match state headers and grade lines, flush each state record when a new state header appears. Output to CSV. A few things that will catch you: D.C. is in there, some states use NA without the slash, and a handful of cards have spacing quirks that shift grade positions. Validate against the source before you publish anything.
Once you have the CSV, the useful queries are obvious: who has D/F in Cadastre, who has A in Elevation (your benchmark peer set for acquisition programs), and which states moved more than one letter grade between 2023 and 2025. That last one is the interesting story if the full report validates it.
Full annotated script at null-island-dispatch.com.
From the Community
ASPRS is now an O*NET Ally. That's more significant than it sounds.
ASPRS was recognized as an O*NET Ally by the U.S. Department of Labor earlier this month. What that means in practice: ASPRS now has a formal seat at the table when federal occupational classifications for photogrammetry, remote sensing, and GIS roles are defined. If you've ever tried to hire a GIS Analyst through a government HR system that doesn't recognize the role, or wondered why your job title doesn't map cleanly to a federal pay scale, this is the machinery that governs that. Having ASPRS in the room matters.
→ asprs.org
GPN deadlines worth putting on your calendar
ESIG Awards and Young Professional Scholarships both close June 1. Volunteer Service Award nominations run through July 1. The Vanguard Cabinet Salary and Promotion Survey is open through July 31 — if you're navigating a promotion cycle right now, that dataset is worth having before your next conversation with HR. GIS-Pro 2026 is October 12–15 in Milwaukee.
→ thegpn.org
Closing
Three stories this week that don't look related until they do.
GEOINT spent four days trying to articulate the gap between a GeoAI proof of concept and a system that runs operationally. NASA's SVS team has been quietly closing that gap — on the Moon, against real data, with pipelines that actually ship — for longer than most of the people in Aurora have been working in the field. The GMA shows you, state by state, which programs have done that work and which ones haven't yet.
The grades aren't a ranking of talent or intention. They're a measure of whether the infrastructure actually runs — whether the data is accessible, the governance is durable, and the pipelines are in production rather than perpetually almost-ready. That's the same standard whether you're certifying a lunar landing or submitting a mine permit.
The integration work is the job. The grade is just how you find out if you've done it.
Until next week.
— Chris Lyons