Why Your Hydrology Model Doesn't Look Broken Anymore
Null Island Dispatch — Issue #8 | Welcome to Ghost.
THE SIGNAL
The U.S. Finally Has Seamless Elevation Data — And Now You Can Actually Train Models on It
If you've ever tried to build a machine learning model for flood prediction, landslide risk, or terrain-based agriculture across the country, you've run into the same wall: the elevation data looks broken at the seams.
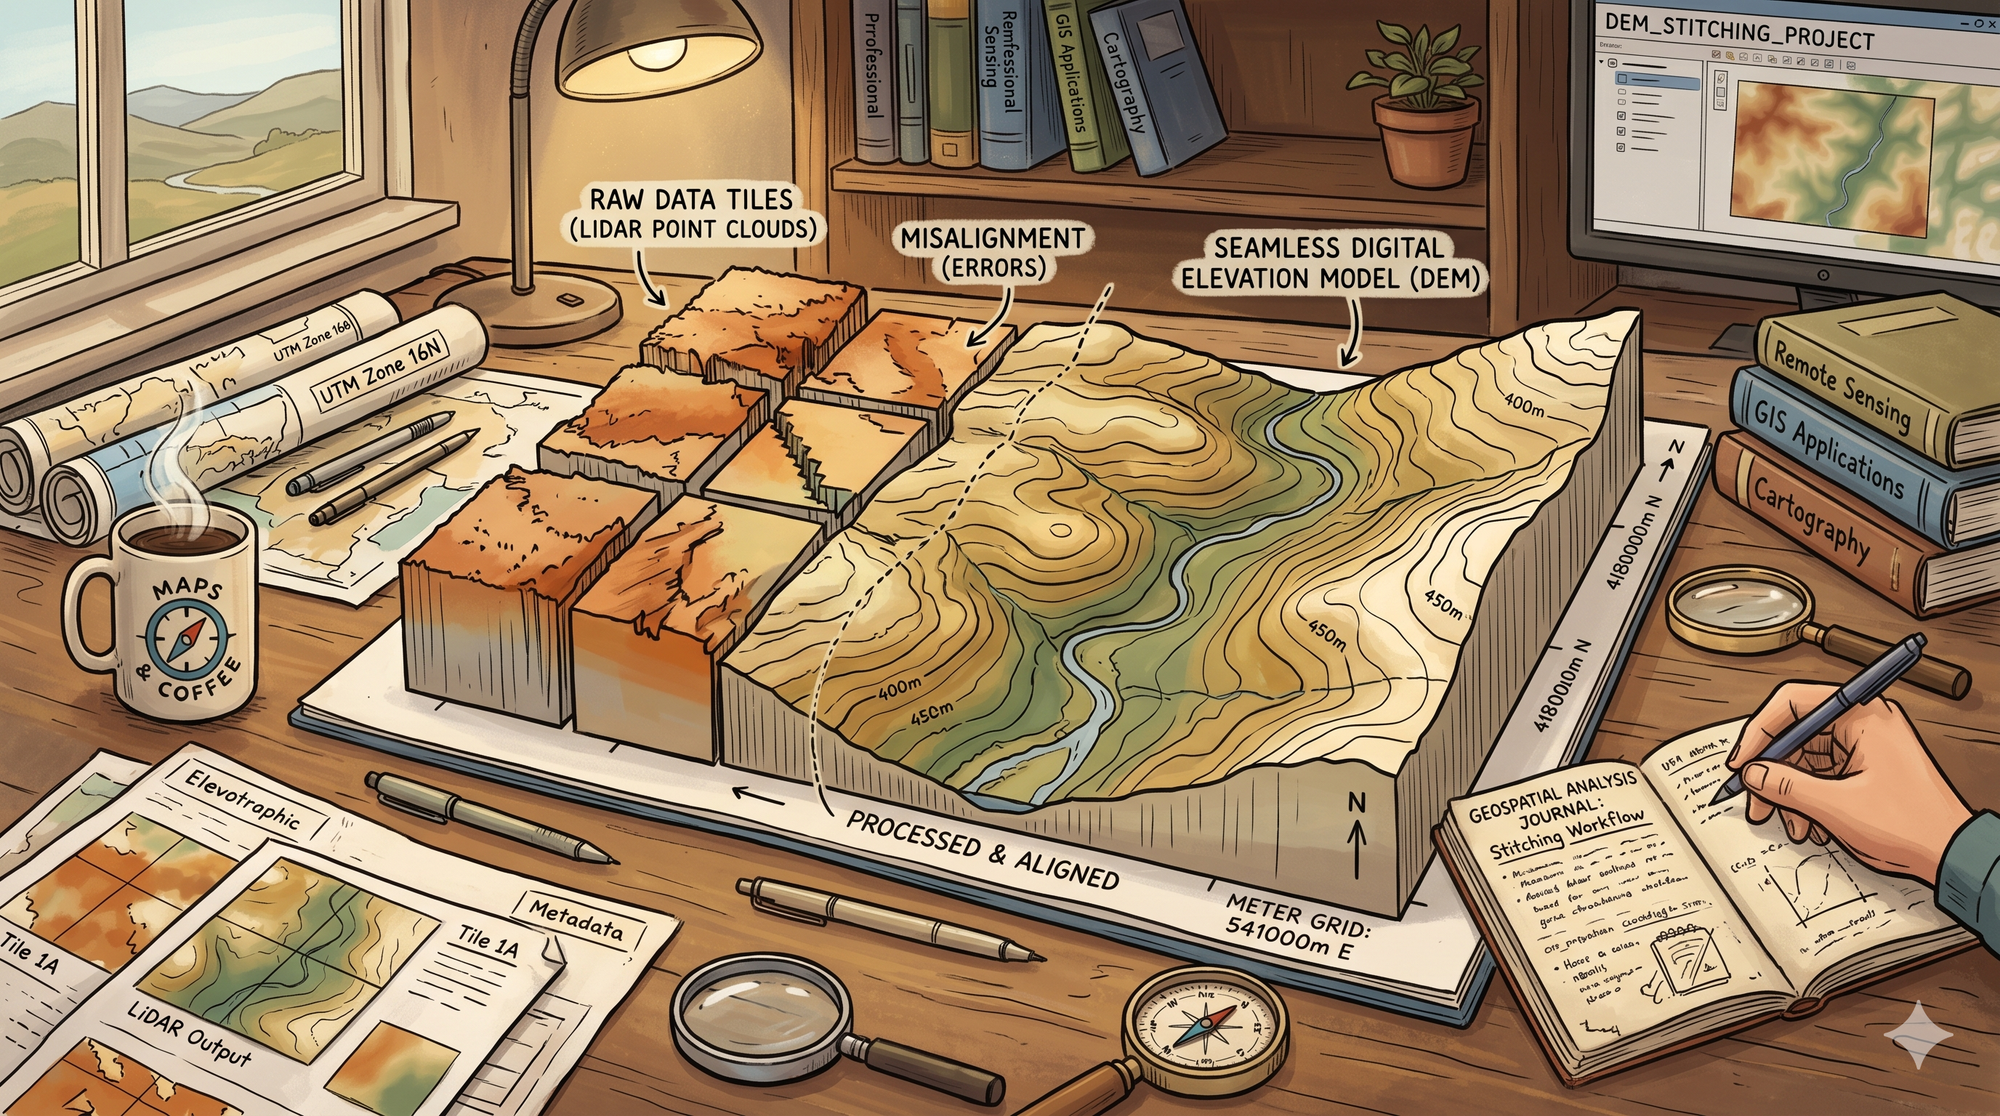
USGS collects excellent lidar across the U.S., but each project gets published independently. A 2018 dataset from one region, 2024 data from another. Different sensors, different processing, different timing. Merge them together and you get elevation discontinuities at project boundaries — sometimes a meter or two of artificial drop or rise that has nothing to do with actual terrain. For ML models, that's noise that messes up your training signal.
So you spend weeks harmonizing the data. Writing code to detect and smooth seams. Testing whether your model's learning terrain variation or just memorizing the artifacts. It's time that should go to actual modeling.
That just changed. USGS released the Seamless 1-Meter DEM (S1M) this spring — basically, they took all that fragmented elevation data and stitched it into one continuous, standardized model. Same processing, same reference frame, no seams. 10 km × 10 km tiles covering the continental U.S., with Hawaii and Puerto Rico coming.
This matters for AI more than most people realize.
For flood and hydrologic models: continuous elevation means your neural networks can actually learn flow patterns instead of chasing data discontinuities. You can train end-to-end models on watershed-scale predictions without preprocessing the seams out. That translates to faster convergence and better generalization.
For terrain-based climate and agriculture models: elevation is a fundamental feature — it drives temperature, precipitation, soil moisture, crop viability. With seamless data, your models stop wasting capacity learning to handle data artifacts and can focus on real spatial patterns.
For change detection and monitoring: if you're using lidar time-series or comparing elevation changes over time, discontinuities in the base DEM create false signals. Consistent baseline data means your models can actually detect real change.
For foundation models: anyone building geospatial foundation models needs training data with consistent, predictable quality. S1M is that. It's elevation data with standardized metadata, predictable tiling, and known provenance. That's the kind of input that actual ML training pipelines want.
There's also infrastructure benefit. S1M is built on a standardized pipeline — same projection, same processing method, same reference system applied nationwide. When the U.S. updates its elevation reference systems later this year, S1M can be updated systematically instead of requiring piecemeal recalibration of dozens of datasets. That's the foundation for continuous data improvement without breaking existing models.
If you're building anything with elevation data — models, analysis, applications — you just got cleaner input that doesn't require weeks of preprocessing. That's a real operational win.
FROM THE FIELD
State Elevation Data Is Getting Graded — And The Results Are Messier Than You'd Think
NSGIC's Geospatial Maturity Assessment is the closest thing we have to a national-level baseline on which states have their GIS act together and which ones don't. If you care about the state of geospatial infrastructure in the U.S., it's worth paying attention to.
The GMA grades states on coordination and individual data themes — addresses, elevation, transportation, imagery, cadastre, that kind of thing. For elevation specifically, the grades are all over the place. Some states got A's. Some got C's. Kentucky got A- for elevation, which is genuinely good — the state's put real effort into lidar collection and integration. But look at the broader pattern and you see inconsistency.
Part of the problem is orthoimagery. A lot of states struggle with leaf-on imagery collection (the seasonally-correct aerial photos that matter for agriculture and forestry). Kentucky's C+ on leaf-on is honest — capturing statewide leaf-on imagery on any kind of regular schedule is expensive and competitive with other priorities. The thing is, states like Arkansas also got a C+ on leaf-on, but they got an A overall. Some states prioritize differently.
The real insight from GMA isn't that you can rank states as "good" or "bad." It's that state-level geospatial coordination is genuinely fragmented. Some states pour resources into elevation and elevation derivatives (lidar, hydro-conditioning). Others focus on imagery. Some have strong address programs to support NG911, others don't. And there's almost no consistency in what "statewide imagery" means — does it mean monthly updates? Annual? Every five years? Different states answered differently.
What matters: if you're building a national-scale application or model, you can't assume consistent data across state boundaries. Each state has different priorities, different funding models, different technical capabilities. The USGS S1M DEM is useful because it standardizes what was fragmented at the state level. That's not shadowing the work states have done. It's acknowledging that state-level coordination, while necessary, is fundamentally resource-constrained.
HANDS ON
Getting S1M Into Your Workflow
S1M is available through OpenTopography, USGS ScienceBase, and The National Map. Here's the fastest path to working with it:
Identify your area first. Tiles are named by geographic coordinates (e.g., USGS_S1M_20250415_n39w107_012_20250415.tif). Know your bounds, predict your tile names, download what you need.
Use USGS 3DEP viewer or OpenTopography to search. Both let you draw a box and filter for coverage. Simple interface.
Script batch downloads with web services. USGS exposes S1M through standard OGC web services. If you need a region's worth of data, automate it. Faster than clicking tiles individually.
Understand the vertical reference. All S1M tiles use NAVD88 as the elevation reference. That's being updated nationally this year. Think about whether your project timeline needs the updated reference or if current data works.
Check metadata per tile. Each file includes source data info, collection date, processing method. Important if you're assessing quality or building models where consistency matters.
The 10 km × 10 km tile size is genuinely useful — big enough for regional analysis, small enough to manage without special infrastructure. Regional work typically means 50–500 tiles depending on your area.
THE ROUNDUP
USGS is next building seamless hydrography data. S1M is phase one of a larger initiative to create standardized, continuous 3D geographic data for the U.S. The next phase is hydrography — flowlines, breaklines, water-surface elevations — all aligned to the same system. That matters because it standardizes how water is represented across the country, making hydrologic and flood models way more consistent.
European navigation conference in Vienna, April 28–30. GNSS and positioning community gathering to discuss resilience, modernization, and infrastructure policy. Overlaps with U.S. efforts on positioning system modernization.
Octave (formerly Luciad) released Alto 2026.0. New visualization platform with features for defense and critical infrastructure mapping. Worth evaluating if you're building geospatial applications for infrastructure planning or analysis.
UK Hydrographic Office expanding maritime charting. Ongoing effort to modernize electronic navigation charts for UK and international waters. Relevant if you work in coastal or marine spatial planning.
Foundation model companies are quietly building geospatial training datasets. Several frontier model labs are assembling elevation, imagery, and vector data to fine-tune multimodal models for geospatial tasks. S1M is exactly the kind of standardized, well-documented data that makes sense for training pipelines.
NEXT WEEK
Issue #9 is about the practical side of the reference system updates coming this year — what it means for your existing models and infrastructure, how to think about forward compatibility, and what to prioritize if you can only update part of your stack.
Null Island Dispatch is an independent weekly newsletter on geospatial technology, geodesy, and surveying. Views are my own.
null-island-dispatch.com